What Is a Working Capital Calculator?
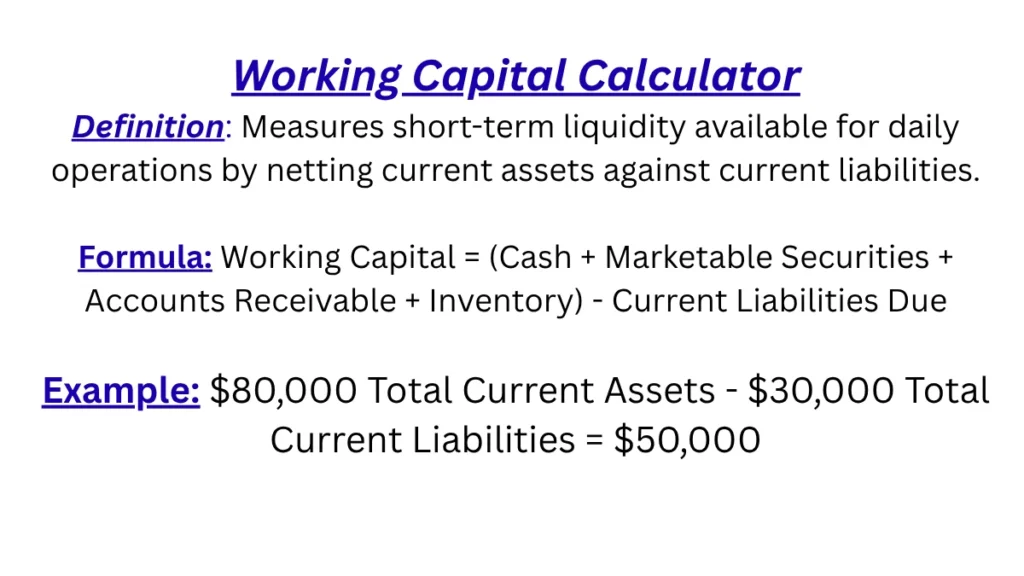
A Working Capital Calculator is a tool that measures the short-term financial resources available to a business after accounting for its short-term obligations. It takes two inputs—current assets and current liabilities—and calculates the difference.
Working Capital Results
This tool is useful for:
- Business owners tracking day-to-day financial health
- Entrepreneurs planning cash needs
- Students learning financial statement analysis
- Investors assessing short-term liquidity
- Finance professionals preparing reports
- Lenders reviewing loan applications
Working capital generally measures short-term financial resources available after considering short-term obligations. A positive result suggests the business can cover its near-term liabilities. A negative result may signal a shortfall that needs attention.
How Does a Working Capital Calculator Work?
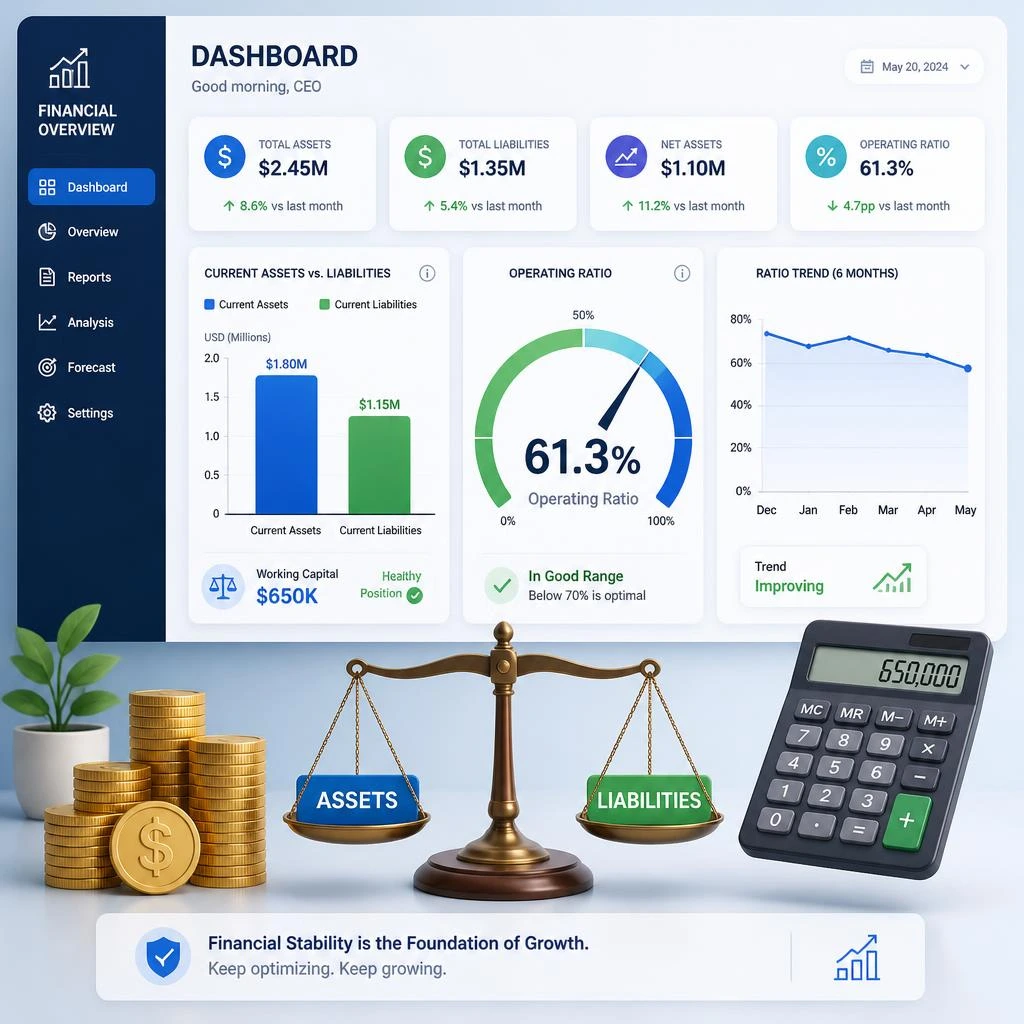
The calculation is simple. The calculator takes your current assets and subtracts your current liabilities. The result is your net working capital.
Net Working Capital = Current Assets − Current Liabilities
Current assets are resources expected to be converted into cash or used within a year, such as cash, accounts receivable, and inventory.
Current liabilities are obligations due within a year, such as accounts payable, short-term debt, and accrued expenses.
If current assets exceed current liabilities, working capital is positive. If liabilities exceed assets, working capital is negative.
Working Capital Formula
Net Working Capital = Current Assets − Current Liabilities
Example:
Current Assets = $200,000
Current Liabilities = $125,000
Net Working Capital = $200,000 − $125,000 = $75,000
This means the business has $75,000 in short-term resources after covering its short-term obligations. Whether that amount is adequate depends on the size, industry, and operating cycle of the business.
What Are Current Assets?
Current assets are resources a business expects to use, sell, or convert into cash within one year. Common examples include:
Cash: Money in bank accounts and on hand.
Accounts receivable: Money customers owe for goods or services already delivered.
Inventory: Goods held for sale or raw materials used in production.
Short-term investments: Investments that can be easily converted to cash.
Prepaid expenses: Payments made in advance, such as rent or insurance.
Not every business has the same asset structure. A software company may have minimal inventory, while a retailer may hold significant stock.
What Are Current Liabilities?
Current liabilities are obligations a business must pay within one year. Common examples include:
Accounts payable: Money owed to suppliers.
Short-term debt: Loans or credit lines due within a year.
Accrued expenses: Expenses incurred but not yet paid, such as wages or interest.
Taxes payable: Taxes owed to authorities.
Deferred revenue: Payments received for goods or services not yet delivered.
These obligations must be covered using current assets or new financing.
What Is the Working Capital Ratio?
The working capital ratio, commonly called the current ratio, compares current assets to current liabilities.
Current Ratio = Current Assets ÷ Current Liabilities
Example:
Current Assets = $200,000
Current Liabilities = $100,000
Current Ratio = $200,000 ÷ $100,000 = 2.00
A current ratio of 2.00 means the business has $2 in current assets for every $1 in current liabilities. A ratio above 1.00 suggests the business can cover its short-term obligations. A ratio below 1.00 may indicate potential liquidity issues.
There is no universally ideal ratio. Appropriate levels vary by industry, business model, and company size.
You can check your own numbers using the current ratio calculator.
What Is an Operating Ratio?
The operating ratio shows operating costs as a percentage of net sales. It helps measure how much of each sales dollar is consumed by operating expenses.
Operating Ratio = (Operating Costs ÷ Net Sales) × 100
The exact presentation can vary depending on accounting conventions and the context in which the ratio is used.
Example:
Operating Costs = $600,000
Net Sales = $1,000,000
Operating Ratio = ($600,000 ÷ $1,000,000) × 100 = 60%
This means 60 cents of every sales dollar goes toward operating costs. The remaining 40 cents contributes to other items such as interest, taxes, and profit.
Working Capital vs. Operating Ratio
| Feature | Working Capital | Operating Ratio |
|---|---|---|
| What It Measures | Short-term financial resources after obligations | Operating costs as a share of sales |
| Formula | Current Assets − Current Liabilities | (Operating Costs ÷ Net Sales) × 100 |
| Main Purpose | Assess short-term liquidity | Assess operating cost efficiency |
| Type of Information | Balance sheet | Income statement |
| Common Users | Owners, lenders, investors | Managers, analysts, investors |
| Interpretation | Positive is generally better than negative | Lower generally means costs are a smaller share of sales |
Working capital focuses on short-term financial resources and obligations. Operating ratio focuses on operating costs relative to sales. They answer different questions and are most useful when reviewed together.
How to Calculate Working Capital
Step 1: Identify current assets from the balance sheet.
Step 2: Identify current liabilities from the balance sheet.
Step 3: Subtract current liabilities from current assets.
Step 4: Interpret the result.
Example:
Cash: $40,000
Accounts Receivable: $80,000
Inventory: $60,000
Prepaid Expenses: $10,000
Total Current Assets: $190,000
Accounts Payable: $50,000
Short-Term Debt: $30,000
Accrued Expenses: $20,000
Total Current Liabilities: $100,000
Net Working Capital = $190,000 − $100,000 = $90,000
How to Calculate the Operating Ratio
Step 1: Determine operating costs (operating expenses plus cost of goods sold, depending on the format used).
Step 2: Determine net sales.
Step 3: Divide operating costs by net sales.
Step 4: Multiply by 100 to express as a percentage.
Example:
Operating Costs: $450,000
Net Sales: $900,000
Operating Ratio = ($450,000 ÷ $900,000) × 100 = 50%
Working Capital Ratio Example
Example 1:
Current Assets: $300,000
Current Liabilities: $150,000
Net Working Capital: $300,000 − $150,000 = $150,000
Current Ratio: $300,000 ÷ $150,000 = 2.00
Example 2:
Current Assets: $300,000
Current Liabilities: $250,000
Net Working Capital: $300,000 − $250,000 = $50,000
Current Ratio: $300,000 ÷ $250,000 = 1.20
The second example shows how an increase in current liabilities reduces both net working capital and the current ratio. The business still has positive working capital, but its cushion is smaller.
Operating Ratio Example
Example 1:
Operating Costs: $500,000
Net Sales: $1,000,000
Operating Ratio: ($500,000 ÷ $1,000,000) × 100 = 50%
Example 2:
Operating Costs: $700,000
Net Sales: $1,000,000
Operating Ratio: ($700,000 ÷ $1,000,000) × 100 = 70%
The second result indicates a higher share of sales is being consumed by operating costs. Whether 70% is a concern depends on the industry, business model, and other financial measures. A software company and an airline will have very different typical operating ratios.
You can test different scenarios with the operating ratio calculator.
Factors That Affect Working Capital
Sales volume: Higher sales may increase receivables and inventory.
Inventory levels: More stock ties up cash.
Accounts receivable: Slow customer payments increase receivables.
Accounts payable: Longer supplier terms can preserve cash.
Cash management: Efficient cash handling supports liquidity.
Seasonal demand: Some businesses need more working capital at certain times of year.
Supplier payment terms: Negotiated terms affect cash flow.
Customer payment terms: Credit policies affect receivables.
Short-term borrowing: Loans can boost current assets but also current liabilities.
Business growth: Rapid growth often requires more working capital.
Factors That Affect the Operating Ratio
Operating expenses: Higher expenses increase the ratio.
Sales revenue: Higher sales reduce the ratio, all else being equal.
Labor costs: Wages and salaries are major operating costs.
Rent: Facility costs affect the ratio.
Utilities: Energy and service costs contribute.
Administrative expenses: Office and management costs add to the ratio.
Production costs: For product businesses, these are significant.
Efficiency: Better processes can lower costs.
Pricing: Higher prices can improve the ratio.
Changes in sales volume: Volume affects how fixed costs are spread.
Why Working Capital Matters
Businesses monitor working capital to:
Pay short-term obligations on time
Manage day-to-day operations
Purchase inventory
Manage customer credit
Maintain cash flow
Support business growth
Positive working capital provides a cushion. Negative working capital may require short-term financing or other corrective action.
Why Operating Ratio Matters
The operating ratio helps businesses understand the relationship between operating costs and sales. It can be used for:
Cost control
Operating efficiency analysis
Profitability analysis
Performance comparison over time
Identifying changes in operating expenses
The ratio should be reviewed alongside other financial measures, not in isolation.
If you want to compare operating efficiency with overall profitability, try the profit margin calculator.
Common Working Capital Mistakes
Mixing long-term assets with current assets: Only include assets expected to convert to cash within a year.
Forgetting current liabilities: All short-term obligations must be included.
Using incorrect figures: Errors in financial statements carry through.
Confusing working capital with cash: Working capital includes receivables and inventory, not just cash.
Ignoring accounts receivable: Outstanding customer payments matter.
Ignoring inventory: Stock ties up cash and affects liquidity.
Comparing businesses with different operating models: A retailer and a software company have different norms.
Assuming positive working capital always means strong financial health: Context matters.
Common Operating Ratio Mistakes
Using the wrong sales figure: Use net sales, not gross sales.
Including non-operating costs incorrectly: Interest and taxes are typically excluded.
Confusing operating costs with total expenses: Only operating costs belong in the numerator.
Comparing unrelated businesses: Industry norms vary widely.
Looking at one period only: Trends matter more than a single number.
Assuming a lower ratio is always better: Context and industry matter.
Working Capital Calculator vs. Manual Calculation
| Feature | Calculator | Manual Calculation |
|---|---|---|
| Speed | Instant | Slower |
| Ease of Use | Simple | Requires care |
| Formula Transparency | Depends on tool | Fully visible |
| Risk of Arithmetic Errors | Low | Higher |
| Best Use | Quick checks, repeated use | Learning, verification |
Both approaches produce the same result when correct figures and formulas are used.
How Accurate Is a Working Capital Calculator?
A calculator can accurately perform the mathematical calculation when correct inputs are supplied. The quality of the result depends on:
Accurate financial data
Correct classification of assets and liabilities
Correct accounting period
Correct formula
Proper interpretation
The calculator itself does not determine overall business financial health. It performs arithmetic. Interpretation requires context.
When Should You Use a Working Capital Calculator?
Monthly financial reviews
Business planning
Cash-flow analysis
Budgeting
Loan preparation
Investor discussions
Financial reporting
Comparing business performance
Monitoring short-term financial position
Working Capital and Operating Ratio Together
Looking at both measures provides more useful information than relying on one. Working capital shows short-term financial resources. The current ratio shows the relationship between current assets and liabilities. The operating ratio shows operating costs relative to sales.
These measures answer different questions:
Can the business meet short-term obligations?
How efficiently is the business managing operating costs?
Is the business generating enough sales to cover its costs?
Together, they provide a fuller picture of financial performance.
The Interaction Between Working Capital Levels and the Operating Ratio
Understanding how working capital levels interact with your operating ratio is essential for anyone managing business finances. These two metrics work together to reveal the true financial health of your company. When you use a working capital calculator operating ratio tool, you can see exactly how these numbers connect and what they mean for your daily operations.
Working capital represents the difference between your current assets and current liabilities. The operating ratio shows how efficiently your business uses its resources to generate revenue. When working capital drops too low, your operating ratio often suffers because you lack the flexibility to cover routine expenses.
The relationship works both ways. A healthy operating ratio supports stronger working capital by ensuring your business generates enough income to cover costs while maintaining reserves. When the operating ratio climbs too high, it eats into the cash available for working capital, creating a cycle that can be difficult to break without careful planning.
Income Statement vs. Balance Sheet: Reconciling Ratios Across Financial Reports
Your income statement and balance sheet tell different parts of the same story. Reconciling ratios across these two financial reports helps you catch inconsistencies before they become serious problems.
The income statement shows revenue and expenses over a period. The balance sheet provides a snapshot of assets and liabilities at a specific moment. When you calculate ratios using numbers from both reports, you get a more complete picture of financial health.
For example, your receivables turnover ratio uses net credit sales from the income statement and average accounts receivable from the balance sheet. If these numbers don’t align properly, you might be missing something important about your collection practices or sales patterns.
Using a cash conversion cycle calculator helps you see how these ratios work together. The CCC combines days inventory outstanding, days sales outstanding, and days payables outstanding to show how long cash stays tied up in operations.
How to Calculate Total Operating Costs When Operating Expenses Are Omitted
Sometimes financial statements don’t clearly show operating expenses. This happens more often than you might think, especially with smaller businesses or those using simplified accounting methods.
When operating expenses are missing from the income statement, you can calculate them by working backward from other known figures. Start with net sales and subtract the cost of goods sold to get gross profit. Then subtract net income from gross profit to estimate total operating expenses.
This approach isn’t perfect, but it gives you a reasonable estimate for ratio calculations. Just be aware that this method assumes no unusual items or one-time charges are distorting the numbers.
A business overhead expense calculator can help you organize these calculations. It breaks down different expense categories so you can see where your money actually goes.
The Mathematical Effects of Rising Inventory Costs on the Current Ratio
When inventory costs rise, your current ratio changes in ways that might surprise you. The current ratio divides current assets by current liabilities. Inventory is a major component of current assets for product-based businesses.
As inventory costs increase, the value of your current assets rises on paper. This pushes your current ratio higher, which looks good at first glance. But here’s the problem: that increase doesn’t reflect real liquidity improvement.
Higher inventory costs mean you’ve tied up more cash in stock. If those costs keep rising, you might struggle to sell inventory at profitable prices. Your current ratio looks healthy, but your actual cash position could be deteriorating.
This is why analysts often look at the quick ratio alongside the current ratio. The quick ratio excludes inventory, showing whether you can meet short-term obligations without selling stock.
Adjusting Your Operating Cost Calculations for Service-Based vs. Product Businesses
Service businesses and product businesses have fundamentally different cost structures. Your operating cost calculations need to reflect these differences.
For service businesses, the cost of goods sold is often minimal or nonexistent. The main costs are labor, technology, and overhead. Operating expenses make up most of the cost structure.
Product businesses have significant COGS that includes materials, manufacturing, and shipping. Operating expenses come on top of these direct costs.
When calculating operating ratios, service businesses typically show higher gross margins but also higher operating expense ratios. Product businesses show lower gross margins but may have more predictable cost patterns.
Adjusting your calculations means understanding which costs are direct versus indirect for your specific business model.
How Accelerating Accounts Receivable Changes Cash without Shifting Net Working Capital
Here’s a counterintuitive concept: you can speed up cash collection without changing your net working capital. How? By converting one current asset into another.
When you collect accounts receivable, cash increases and receivables decrease by the same amount. Total current assets stay the same. Net working capital, which is current assets minus current liabilities, remains unchanged.
But your cash position improves dramatically. You now have money available to pay bills, invest in growth, or handle emergencies.
This is why managing receivables turnover matters so much. Faster collection doesn’t change the accounting equation, but it absolutely changes your operational flexibility.
A percentage decrease calculator can help you track how receivables balances change over time. Monitoring these trends reveals whether your collection efforts are working.
Analyzing Sales Velocity Metrics Alongside Short-Term Liquidity Ratios
Sales velocity measures how quickly you’re generating revenue. Short-term liquidity ratios measure your ability to meet immediate obligations. Analyzing them together gives you a complete picture of operational efficiency.
High sales velocity with strong liquidity ratios means your business is firing on all cylinders. You’re generating revenue quickly and have the cash to support operations.
Low sales velocity with weak liquidity ratios signals trouble. You’re not generating enough revenue, and you lack the cash reserves to weather slow periods.
The most dangerous scenario is high sales velocity with weak liquidity. This often happens when businesses grow too fast without managing cash flow properly. Sales are booming, but you can’t collect fast enough to pay bills.
Tracking these metrics together helps you spot problems before they become crises.
The Mathematical Impact of Unearned Revenue on Total Current Liabilities
Unearned revenue represents money you’ve received but haven’t yet earned. It sits on your balance sheet as a liability because you owe products or services to customers.
When unearned revenue increases, your total current liabilities rise. This pushes your current ratio lower, even though your cash position has actually improved from receiving the payments.
This creates an interesting paradox. Collecting advance payments feels good because cash increases. But accounting rules require you to record a liability, which makes your liquidity ratios look worse.
Understanding this dynamic helps you interpret your financial statements correctly. A declining current ratio isn’t always bad news, especially when it results from increased unearned revenue.
Calculating the True Cost of Goods Sold (COGS) for Multi-Channel Retail Calculations
Multi-channel retail creates complex COGS calculations. You’re selling through your website, marketplaces, physical stores, and possibly wholesale channels. Each channel has different cost structures.
Direct materials are straightforward. You know what you paid for the products. But allocating shipping costs, payment processing fees, and channel-specific overhead requires careful analysis.
For online sales, you might include pick-and-pack costs, shipping supplies, and platform fees. For physical stores, you’d include display costs, store labor, and shrinkage.
Accurate COGS calculation by channel helps you understand which sales channels are actually profitable. A channel with high sales volume but poor margins might be dragging down your overall performance.
How Short-Term Debt Restructuring Alters Your Daily Liquidity Cushion
Restructuring short-term debt changes your liquidity position immediately. Converting short-term debt to long-term debt reduces current liabilities, which improves your current ratio.
But this improvement comes with trade-offs. Long-term debt often carries higher interest rates. You’re trading short-term flexibility for long-term stability.
The daily liquidity cushion represents the cash you have available beyond immediate obligations. Restructuring can improve this cushion by spreading out payment obligations over time.
However, if restructuring involves fees or penalties, those costs reduce your cash position upfront. You need to weigh the immediate costs against the long-term benefits.
Tracking Ratios Week-Over-Week to Identify Operational Cash Flow Slippage
Weekly ratio tracking catches problems before they show up in monthly reports. Small changes accumulate over time, and weekly monitoring helps you spot negative trends early.
Create a simple dashboard that tracks key ratios every week. Include current ratio, quick ratio, receivables turnover, and inventory turnover. Compare each week’s numbers to the previous week and to the same week last year.
When you see a ratio declining for three or more consecutive weeks, investigate immediately. Something in your operations has changed, and you need to understand what.
This proactive approach prevents small issues from becoming major problems. You can adjust operations before cash flow slippage becomes a crisis.
The Formulas Behind Accounts Receivable Turnover and Its Impact on Available Cash
The accounts receivable turnover formula divides net credit sales by average accounts receivable. This tells you how many times you collect your average receivables balance during a period.
Higher turnover means you’re collecting faster. Lower turnover means collections are slow, and cash is tied up in unpaid invoices.
The impact on available cash is direct. If your annual credit sales are $1 million and your average receivables are $200,000, your turnover is 5. That means you collect your average balance five times per year, or roughly every 73 days.
If you improve turnover to 6, you collect every 61 days. That’s 12 days faster, which frees up significant cash for operations.
How Prepaying Operational Expenses Distorts Short-Term Asset Ratios
Prepaying expenses creates a current asset called prepaid expenses. This increases your total current assets and improves your current ratio temporarily.
But prepaying doesn’t actually improve your financial position. You’ve exchanged one asset (cash) for another (prepaid expense). The total value of your current assets remains the same.
The distortion occurs because prepaid expenses aren’t as liquid as cash. You can’t use prepaid insurance to pay your employees or suppliers. When analysts adjust for this, they often exclude prepaid expenses from liquidity calculations.
Be aware of this distortion when interpreting your ratios. A current ratio that looks healthy because of large prepaid balances might not reflect true liquidity.
Calculating the Breakdown of Fixed vs. Variable Operating Costs in Net Sales
Understanding the split between fixed and variable costs helps you predict how changes in sales affect profitability. Fixed costs stay constant regardless of sales volume. Variable costs change proportionally with sales.
To calculate the breakdown, start by identifying all operating costs. Classify each as fixed or variable based on how it behaves when sales change.
Divide fixed costs by net sales to get the fixed cost ratio. Divide variable costs by net sales to get the variable cost ratio. Together, these should approximate your total operating expense ratio.
Businesses with high fixed costs have higher operating leverage. Small sales increases produce large profit increases, but sales declines hit profits hard. Businesses with high variable costs have more flexibility but lower profit margins.
Standardizing Metric Inputs Across Inconsistent Historical Financial Statements
Historical financial statements often use inconsistent formats and definitions. Standardizing inputs ensures your ratio analysis compares apples to apples.
Start by creating a master template for financial data. Define exactly which line items go into each category. For example, decide whether short-term investments count as cash equivalents or separate current assets.
Apply this template to every historical statement you analyze. Make adjustments where necessary to ensure consistency. Document your methodology so you can explain any changes.
This standardization takes time upfront, but it pays off with more reliable trend analysis. You can trust that changes in ratios reflect actual performance changes, not accounting inconsistencies.
Ratio Comparison Table: Key Metrics at a Glance
| Ratio/Metric | Formula | What It Measures | Healthy Range |
|---|---|---|---|
| Current Ratio | Current Assets ÷ Current Liabilities | Short-term liquidity | 1.5 – 3.0 |
| Quick Ratio | (Current Assets – Inventory) ÷ Current Liabilities | Immediate liquidity | 1.0 – 2.0 |
| Operating Ratio | Operating Expenses ÷ Net Sales | Operational efficiency | 0.5 – 0.8 |
| Working Capital | Current Assets – Current Liabilities | Short-term financial health | Positive |
| Receivables Turnover | Net Credit Sales ÷ Average Receivables | Collection efficiency | 6 – 12 times |
| Inventory Turnover | COGS ÷ Average Inventory | Stock management | 4 – 8 times |
| Cash Conversion Cycle | DIO + DSO – DPO | Cash tied up in operations | Lower is better |
| Fixed Cost Ratio | Fixed Costs ÷ Net Sales | Operating leverage | Industry dependent |
| Variable Cost Ratio | Variable Costs ÷ Net Sales | Cost flexibility | Industry dependent |
Working Capital Components Table
| Component | Category | Impact on Working Capital | Example |
|---|---|---|---|
| Cash | Current Asset | Increases | Bank accounts, petty cash |
| Accounts Receivable | Current Asset | Increases | Unpaid customer invoices |
| Inventory | Current Asset | Increases | Raw materials, finished goods |
| Prepaid Expenses | Current Asset | Increases | Advance rent, insurance |
| Accounts Payable | Current Liability | Decreases | Supplier invoices |
| Short-Term Debt | Current Liability | Decreases | Credit lines, loans |
| Accrued Expenses | Current Liability | Decreases | Wages, interest owed |
| Deferred Revenue | Current Liability | Decreases | Customer prepayments |
| Taxes Payable | Current Liability | Decreases | Sales tax, income tax owed |
Frequently Asked Questions
1. What is a Working Capital Calculator?
It is a tool that calculates net working capital by subtracting current liabilities from current assets.
2. How do you calculate working capital?
Working Capital = Current Assets − Current Liabilities.
3. What is the working capital formula?
Net Working Capital = Current Assets − Current Liabilities.
4. What are current assets?
Resources expected to be converted to cash or used within a year, such as cash, receivables, and inventory.
5. What are current liabilities?
Obligations due within a year, such as accounts payable, short-term debt, and accrued expenses.
6. What is the working capital ratio?
It is the current ratio: Current Assets ÷ Current Liabilities.
7. How do you calculate the current ratio?
Current Ratio = Current Assets ÷ Current Liabilities.
8. What is an Operating Ratio?
It shows operating costs as a percentage of net sales: (Operating Costs ÷ Net Sales) × 100.
9. How do you calculate the operating ratio?
Divide operating costs by net sales, then multiply by 100.
10. What does an operating ratio of 60% mean?
It means 60% of net sales is consumed by operating costs.
11. What is the difference between working capital and current ratio?
Working capital is a dollar amount. The current ratio is a comparison of assets to liabilities.
12. Is working capital the same as cash?
No. Working capital includes cash, receivables, inventory, and other current assets minus current liabilities.
13. Why is working capital important?
It helps businesses meet short-term obligations and manage day-to-day operations.
14. What is a good working capital ratio?
There is no universal ideal. Appropriate ratios vary by industry, business model, and company size.
15. What is a good operating ratio?
There is no universal ideal. It varies by industry and should be reviewed alongside other measures.
Related Calculators and Tools
operating ratio calculator for working capital
accounts receivable turnover ratio calculator
cash conversion cycle calculator
business overhead expense calculator
percentage decrease calculator
commercial mortgage calculator
self-employed mortgage calculator
commercial equipment loan calculator
words to minutes speech calculator
merchant cash advance calculator
Summary
Working capital measures the short-term financial resources available after subtracting current liabilities from current assets. The working capital formula is simple: Current Assets − Current Liabilities. The current ratio compares those same figures as a ratio.
The operating ratio measures operating costs as a percentage of net sales. It helps assess cost efficiency but should be interpreted in context.
Accurate financial inputs matter. Ratios should always be reviewed alongside other measures and with an understanding of the business, industry, and accounting practices.
Disclaimer
Disclaimer: The calculations and information provided on this website are estimates for educational purposes only. Actual financial ratios and metrics vary by business type, industry, and individual circumstances. Please consult a licensed accountant or financial advisor for guidance specific to your situation. This content is for informational purposes only and does not constitute financial or legal advice. Always verify all calculations and assumptions with qualified professionals before making business decisions.